For investors who care about risk control of portfolios, investing in multiple assets is essential. In this article, you will find that 10 assets can achieve very effective diversification for your portfolio.
We will study several experiments below and see why 10 is a reasonable number to diversify your portfolio.
Experiment 1 – A Toy Example: All Assets Are Uncorrelated to Each Other
Imagine we are given N assets (such as ETFs or Mutual Funds), and let’s make the following two assumptions about these assets:
- All assets have exactly the same risk, measured as volatility, labeled as Sigma, and let’s assume Sigma = 25% (annualized)
- Each pair of assets has exactly the same correlation to each other, labeled as Rho, and let’s assume Rho = 0, i.e., each pair of assets is uncorrelated to each other
Now you use these N assets to construct an equal-weighted portfolio, which means each asset is allocated 1/N of the capital (so that the total allocation of these assets adds up to 1). So what is the risk(volatility) of this portfolio? A little math shows the volatility of this equal-weighted portfolio is simply Sigma/square_root(N). What does this mean? Well, it means the portfolio risk decreases as the number of assets grows in this portfolio. The chart below helps you visualize how increasing the number of assets reduces the portfolio risk.
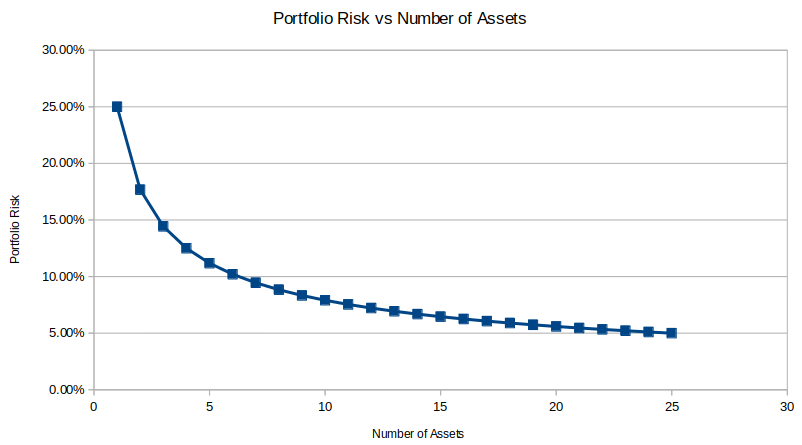
As you can see, in this idealized world, adding extra assets always helps you further diversify your portfolio and reduce its risk, although the marginal benefits decrease as the number of assets grows. To put out a few numbers, portfolio risk halves with 4 assets, is 1/3 of original risk with 9 assets, and is 1/4 with 16 assets,… In a crazy world if you can invest an infinite number of assets in your portfolio then the portfolio risk approaches 0!
Experiment 2: What if The pair-wise correlations are not zero?
Forcing the mutual correlation to be zero is too restricted, so let’s relax our assumptions a bit and see what happens when the correlation Rho is not zero. Let’s continue with the toy example from Experiment 1 but now look at the portfolio risk at different levels of Rho. 10%, 25%, and 50% are tested for correlation Rho, and for ease of comparison, zero correlation is also added to the charts.
Assume Different Levels of Correlation Among Assets
There are two interesting aspects to the comparison:
When the mutual correlation Rho is above zero, the curve of portfolio risk quickly plateaus and reaches some stable risk level
the higher the mutual correlation, the higher the plateaued risk level
It’s not unreasonable to say that with about 10 assets, you get pretty good diversification of portfolio risk.
Experiment 3: Use Real-World Assets
Clearly, assuming all assets have the same volatility(25%) and the same mutual correlation is unrealistic, so let’s take real-world assets into the game. To elaborate, I selected about 1000 ETFs that cover different asset classes(Equity, Bonds, etc), different regions(US, EU, etc.), and different industries(Technology, Consumer, Energy sectors, etc.), and calculated the covariation matrix using the historical total returns of these ETFs. Then similar to previous experiments I build an equal-weighted portfolio for any set of selected ETFs. The result is displayed in the “Box” chart [1] below.
Each Asset In Portfolio Is Equal-Weights
It’s necessary to explain the chart in a few more detail. Each “box” on the chart represents the distribution of 10,000 values of portfolio risk, and the middle line in the blue rectangle represents the median of the risk distribution. How did I get 10,000 values of portfolio risk? Well, take the “3 Assets” one as an example, I randomly select 3 assets out of the 1000 ETFs and calculated the risk of an equal-weighted portfolio, and I then repeat this process 10,000 times which then results in 10,000 values of portfolio risk, which is then plotted on the chart corresponding to the “3 Assets” on the x-axis. The same steps are followed for “1 Asset”, “2 Assets”, “4 Assets”, etc.
Looking at the medians of these boxes, it is interesting to see that with around 10 assets the portfolio risk plateaus! Now you look at Experiments 1 and 2, which are super simple toy models, their conclusion is not far from reality!
Experiment 4: Why Equal-Weighted Portfolio? Let The Asset Weights be Different!
Thinking a portfolio with equal-weighted assets is too unrealistic? No problem, let’s make the weights different. In this experiment, I follow exactly the same procedures as in Experiment 3, except that when I build a portfolio with N assets I assign random weights to each of the assets in the portfolio(but still make sure the total weights add up to 100%). Now look at the result below, it is not that different from the equal-weighted experiment!
Assets in Each Portfolio Are Assigned Random Weights
Sure each “box” on the chart might be a bit different from the ones in Experiment 3, but the same conclusion can be made that you don’t need more than 10 assets to achieve effective diversification of your portfolio!
Next time you see your core portfolio has much more than 10 assets you should ask yourself: is this portfolio “over-diversified”?
Reference
[1] https://en.wikipedia.org/wiki/Box_plot