Content
Quizzes and Answers
Quiz 1: Download the price data for TSLA between January 3rd, 2017 and December 30th, 2021, and calculate its daily returns using the shift(1) trick. Then calculate the reward and risk for each year between 2017 and 2021 using the daily return series.
>>> TSLA = yfinance.download(["TSLA"], start="2017-01-03", end="2021-12-31")["Adj Close"]
>>>
>>> TSLA_returns[TSLA_returns.index.year==2017]
Date
2017-01-04    0.046085
2017-01-05   -0.001057
2017-01-06    0.009967
2017-01-09    0.009912
2017-01-10   -0.006096
                ...
2017-12-22   -0.019478
2017-12-26   -0.024324
2017-12-27   -0.017807
2017-12-28    0.011937
2017-12-29   -0.012716
Name: Adj Close, Length: 250, dtype: float64

>>> TSLA_returns[TSLA_returns.index.year==2017].mean()
0.0016930879485460206
>>> TSLA_returns[TSLA_returns.index.year==2017].std()
0.02229355357696138
Loop through all years
>>> for year in range(2017, 2022):
        daily_returns = TSLA_returns[TSLA_returns.index.year == year]
        reward = daily_returns.mean()
        risk = daily_returns.std()
        print("{} {:.5f} {:.5f}".format(year, risk, reward))

2017 2.22936 0.16931
2018 3.68922 0.09320
2019 3.10686 0.13907
2020 5.62554 1.00467
2021 3.45503 0.22476
Use a more efficient method
>>> TSLA_returns.groupby(TSLA_returns.index.year).mean() * 100
Date
2017    0.169309
2018    0.093199
2019    0.139070
2020    1.004672
2021    0.224762
Name: Adj Close, dtype: float64

>>> TSLA_returns.groupby(TSLA_returns.index.year).std() * 100
Date
2017    2.229355
2018    3.689215
2019    3.106863
2020    5.625540
2021    3.455028
Name: Adj Close, dtype: float64
Quiz 2: Similar to Quiz 1, but do the same for the following five asset together: TSLA, WMT, SPY, AGG, and BTC-USD. Once you calculate the reward and risk for all assets of each year, plot two charts: one for reward each year of each asset, and the other for risk each year of each asset.
>>> assets = [ "TSLA", "WMT", "SPY", "AGG", "BTC-USD" ]
>>> asset_prices = yfinance.download(assets, start="2017-01-03", end="2021-12-30")["Adj Close"].dropna()
[ 0% ]
[ 0% ]
[ 0% ]
[ 0% ]
[*********************100%***********************] 5 of 5 completed
>>> asset_returns = (asset_prices / asset_prices.shift(1) - 1).dropna()[assets]
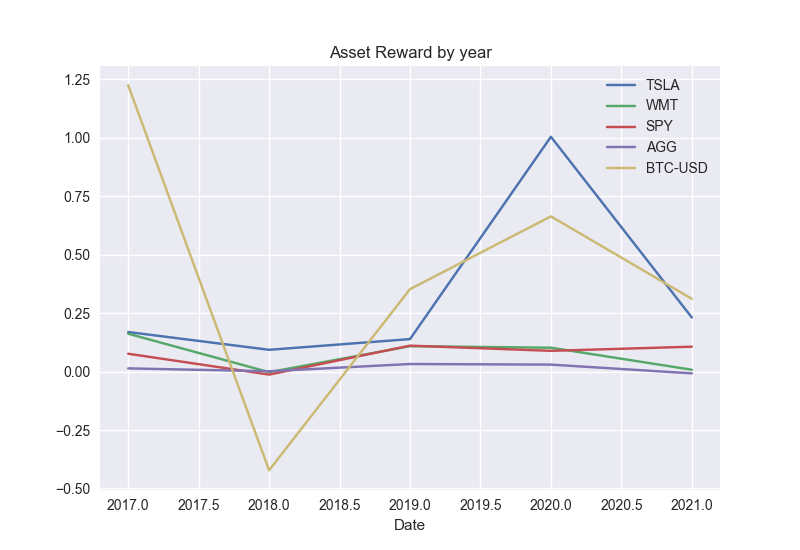
>>> reward_by_year = asset_returns.groupby(asset_returns.index.year).mean() * 100
>>> reward_by_year
TSLA WMT SPY AGG BTC-USD
Date
2017 0.169309 0.162110 0.076447 0.013709 1.225157
2018 0.093199 -0.002483 -0.012875 0.001487 -0.422106
2019 0.139070 0.108724 0.110990 0.032422 0.352910
2020 1.004672 0.102214 0.088811 0.029896 0.664032
2021 0.231498 0.007880 0.106543 -0.007610 0.311319
>>> reward_by_year.plot(title="Asset Reward by year")
<AxesSubplot: title={'center': 'Asset Reward by year'}, xlabel='Date'>
>>> plt.show()
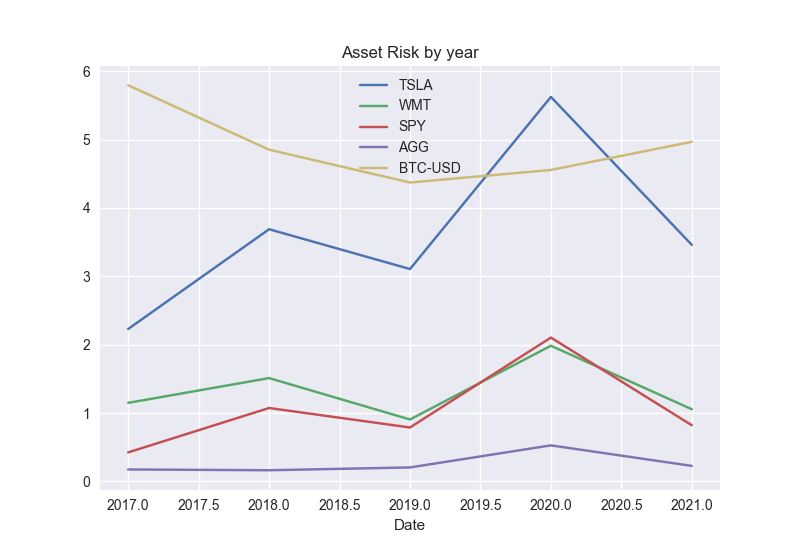
>>> risk_by_year = asset_returns.groupby(asset_returns.index.year).std() * 100
>>> risk_by_year
          TSLA       WMT       SPY       AGG   BTC-USD
Date
2017  2.229355  1.148367  0.423439  0.173982  5.796219
2018  3.689215  1.511008  1.073218  0.162328  4.853322
2019  3.106863  0.905100  0.788112  0.203505  4.372890
2020  5.625540  1.984120  2.103876  0.526435  4.556687
2021  3.460307  1.055029  0.820825  0.226058  4.968553

>>> risk_by_year.plot(title="Asset Risk by year")
<AxesSubplot: title={'center': 'Asset Risk by year'}, xlabel='Date'>
>>> plt.show()