bt: https://pmorissette.github.io/bt/index.html
>>> import bt
>>> import yfinance
>>> import matplotlib.pyplot as plt
>>> prices = yfinance.download(["AGG", "GLD", "SPY"], start="2015-01-01", end="2020-01-01")["Adj Close"]
[*********************100%***********************]  3 of 3 completed
>>> prices
                   AGG         GLD         SPY
Date
2015-01-02   91.961433  114.080002  178.278488
2015-01-05   92.161308  115.800003  175.058868
2015-01-06   92.394440  117.120003  173.409973
2015-01-07   92.377808  116.430000  175.570923
2015-01-08   92.236275  115.940002  178.686417
...                ...         ...         ...
2019-12-24  106.354485  141.270004  307.631104
2019-12-26  106.449127  142.380005  309.268738
2019-12-27  106.591095  142.330002  309.192078
2019-12-30  106.591095  142.630005  307.487427
2019-12-31  106.345039  142.899994  308.234406

[1258 rows x 3 columns]
>>> strategy_eqwt = bt.Strategy("Equal Weight", [ bt.algos.RunMonthly(), bt.algos.SelectAll(), bt.algos.WeighEqually(), bt.algos.Rebalance()])
>>> backtest = bt.Backtest(strategy_eqwt, prices)
>>> result = bt.run(backtest)
>>> result.plot()
>>> plt.show()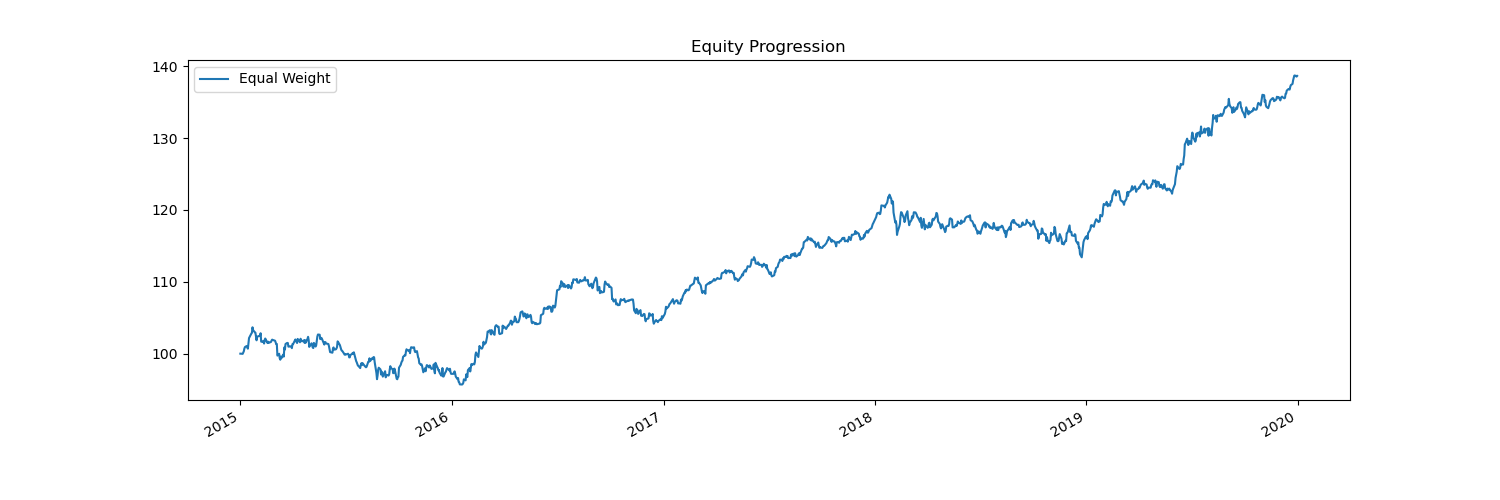
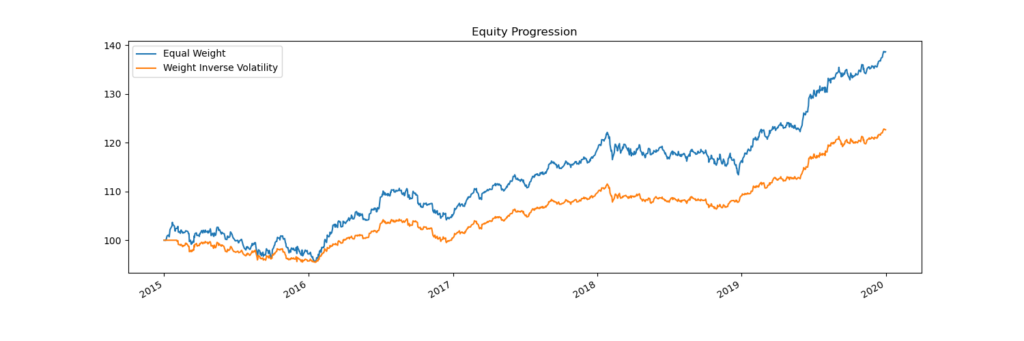
Compare two strategies
>>> strategy_invvol = bt.Strategy("Weight Inverse Volatility", [ bt.algos.RunMonthly(), bt.algos.SelectAll(), bt.algos.WeighInvVol(), bt.algos.Rebalance()])
>>> backtest_invvol = bt.Backtest(strategy_invvol, prices)
>>> result2 = bt.run(backtest, backtest_invvol)
>>> result2.plot()
>>> plt.show()
>>> result2.display()
Stat                 Equal Weight    Weight Inverse Volatility
-------------------  --------------  ---------------------------
Start                2015-01-01      2015-01-01
End                  2019-12-31      2019-12-31
Risk-free rate       0.00%           0.00%

Total Return         38.64%          22.65%
Daily Sharpe         1.15            1.12
Daily Sortino        1.96            1.88
CAGR                 6.76%           4.17%
Max Drawdown         -7.68%          -4.64%
Calmar Ratio         0.88            0.90

MTD                  2.17%           1.37%
3m                   3.97%           2.31%
6m                   6.99%           4.80%
YTD                  19.25%          12.41%
1Y                   19.25%          12.41%
3Y (ann.)            9.56%           6.82%
5Y (ann.)            6.76%           4.17%
10Y (ann.)           -               -
Since Incep. (ann.)  6.76%           4.17%

Daily Sharpe         1.15            1.12
Daily Sortino        1.96            1.88
Daily Mean (ann.)    6.72%           4.16%
Daily Vol (ann.)     5.82%           3.70%
Daily Skew           -0.17           -0.25
Daily Kurt           1.47            1.70
Best Day             1.50%           1.01%
Worst Day            -1.59%          -1.12%

Monthly Sharpe       1.07            1.08
Monthly Sortino      2.73            2.38
Monthly Mean (ann.)  6.36%           4.23%
Monthly Vol (ann.)   5.97%           3.93%
Monthly Skew         0.58            0.18
Monthly Kurt         0.03            0.07
Best Month           5.37%           3.27%
Worst Month          -2.38%          -2.27%

Yearly Sharpe        1.09            1.17
Yearly Sortino       11.91           34.18
Yearly Mean          9.55%           6.50%
Yearly Vol           8.76%           5.54%
Yearly Skew          -0.45           -0.41
Yearly Kurt          0.32            -1.07
Best Year            19.25%          12.41%
Worst Year           -1.60%          -0.38%

Avg. Drawdown        -0.93%          -0.56%
Avg. Drawdown Days   30.77           26.20
Avg. Up Month        1.63%           1.05%
Avg. Down Month      -1.07%          -0.73%
Win Year %           75.00%          75.00%
Win 12m %            89.80%          87.76%